Resources
Client Lab Report Template: What to Include, Without Rebuilding It Every Visit
Most clients won't remember everything you said on the call. A clear report gives them something to come back to. So most practitioners keep a report template in Word, Google Docs or Canva and fill it in after every lab draw. The template is the easy part. Filling it in is the part that takes the evening.
Lab Results Summary
| Marker | Result | My range | Lab range |
|---|---|---|---|
| Progesterone | 0.5 ng/mL | 0 to 1 | 0.1 to 0.9 |
| Estradiol | 64 pg/mL | 40 to 100 | 12.5 to 166 |
| Ferritin | [copy from PDF] | 60 to 110 | [ ] |
| [Marker] | [ ] | [ ] | [ ] |
Whether you build your report in a document, a spreadsheet or software, it has one job: help your client follow their results and your guidance. Here is what a report needs, what makes it genuinely helpful, and some extras that add polish.
The essentials
Must have
Without these, a report is just a page of numbers.
1. The basics
The client's name, the date the labs were drawn, which lab ran them, and your name and practice. The draw date matters most. It is how you and your client tell one set of results from the next.
2. Every result with its unit and range
A number on its own means little to a client. Put the unit beside every value and the range you are comparing it against beside that. If you use functional ranges, label them so the client knows which range is yours and which is the lab's. Watch the units, too: labs don't all report a marker in the same unit, and a mismatch is easy to miss.
Hard to follow
| A | B | |
|---|---|---|
| 1 | Marker | Result |
| 2 | Ferritin | 38 |
Clear
| A | B | C | D | |
|---|---|---|---|---|
| 1 | Marker | Result | Your range | Lab range |
| 2 | Ferritin | 38 ng/mL | 60 to 110 | 30 to 150 |
3. A clear flag on anything outside the range
Clients scan; they don't read every row. A color, a symbol or a simple "outside range" note lets the results worth a conversation stand out without the client hunting for them. The flag only shows where a value sits. What it means belongs in your notes.
No flag
| A | B | C | |
|---|---|---|---|
| 1 | Marker | Result | Your range |
| 2 | Glucose | 84 | 75 to 90 |
| 3 | Vitamin D | 31 | 50 to 80 |
| 4 | TSH | 1.6 | 1.0 to 2.0 |
| 5 | Folate | 16.2 | 15 to 25 |
Flagged
| A | B | C | |
|---|---|---|---|
| 1 | Marker | Result | Your range |
| 2 | Glucose | 84 | 75 to 90 |
| 3 | Vitamin D | 31 | 50 to 80 |
| 4 | TSH | 1.6 | 1.0 to 2.0 |
| 5 | Folate | 16.2 | 15 to 25 |
4. Your notes, in your words
This is the part only you can write, and often the part clients read first. A few lines on what you looked at and what happens next do more than any table. Keep the language simple and explain a term the first time it appears. A client report is not a chart note.
What makes a report genuinely helpful
Strongly helpful
These take more work, which is why they are often the first thing a template leaves out.
Change over time
One set of results is a snapshot. Showing the last few draws side by side lets you and your client see which way things are moving. It is also the hardest part to keep current by hand: every visit means finding the old values, lining up the dates in order and keeping the units consistent.
One marker, four lab draws
| A | B | C | D | E | |
|---|---|---|---|---|---|
| 1 | Marker | 11/18/25 | 2/3/26 | 5/12/26 | 8/25/26 |
| 2 | Vitamin D | 22 | 31 | 44 | 52 |
| 3 | Trend | ||||
Results grouped by panel
Thyroid with thyroid, iron with iron. One long list makes clients work harder, and related results are easy to miss when they sit far apart.
A plain-language line on each marker
One short sentence on what each marker is, so clients aren't left searching terms online. Keep it educational: what the marker is, not what the result means.
A result with a one-line description
| Ferritin | 38 ng/mL |
| The body's main iron storage protein. | |
Extras that add polish
Bonus
These make a report look polished. Plenty of practitioners send a plain spreadsheet and their clients manage fine, so don't let these hold you up.
- Your logo and practice name, so the report looks like it came from you.
- Charts alongside the tables.
- A clean PDF that fits your client portal, with page breaks between sections rather than through the middle of a table.
A few things to avoid
- Forwarding the lab's own printout as the report. It has the numbers but none of your ranges or notes.
- Clinical shorthand. If a term needs explaining, explain it once in plain words.
- Sending results as a plain email attachment. Lab results are health information, so a secure client portal is the safer way to share them.
How My Practice Labs handles this
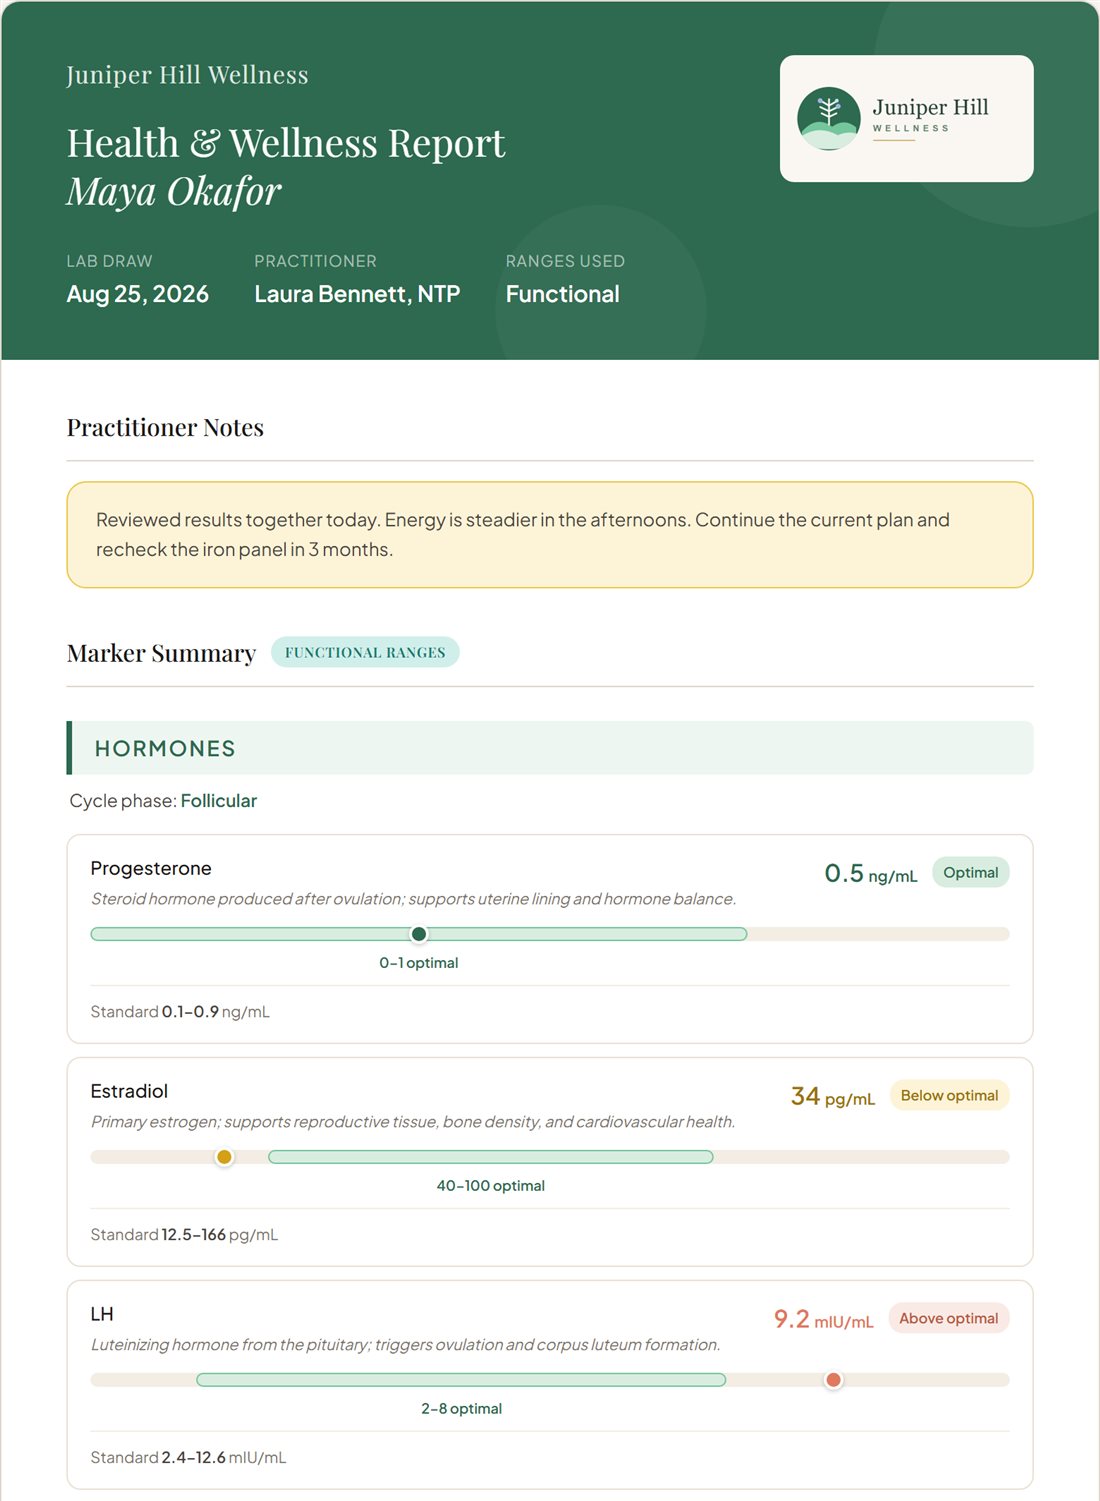
My Practice Labs builds the report from the lab results you import, with nothing to fill in. Every essential above is on it, along with the helpful parts and the extras.
 1
2
3
4
5
- 1Your logo and practice name, added once in Settings and on every report after that.
- 2The basics, including the draw date, your name and credentials, and which ranges the results are shown against.
- 3Your notes, in your words, near the top where clients see them first.
- 4Each result against your range, with a simple bar showing where the value sits and the lab's standard range printed below. Results outside your range stand out without anyone highlighting cells.
- 5A plain-language line on what each marker is, short and educational.
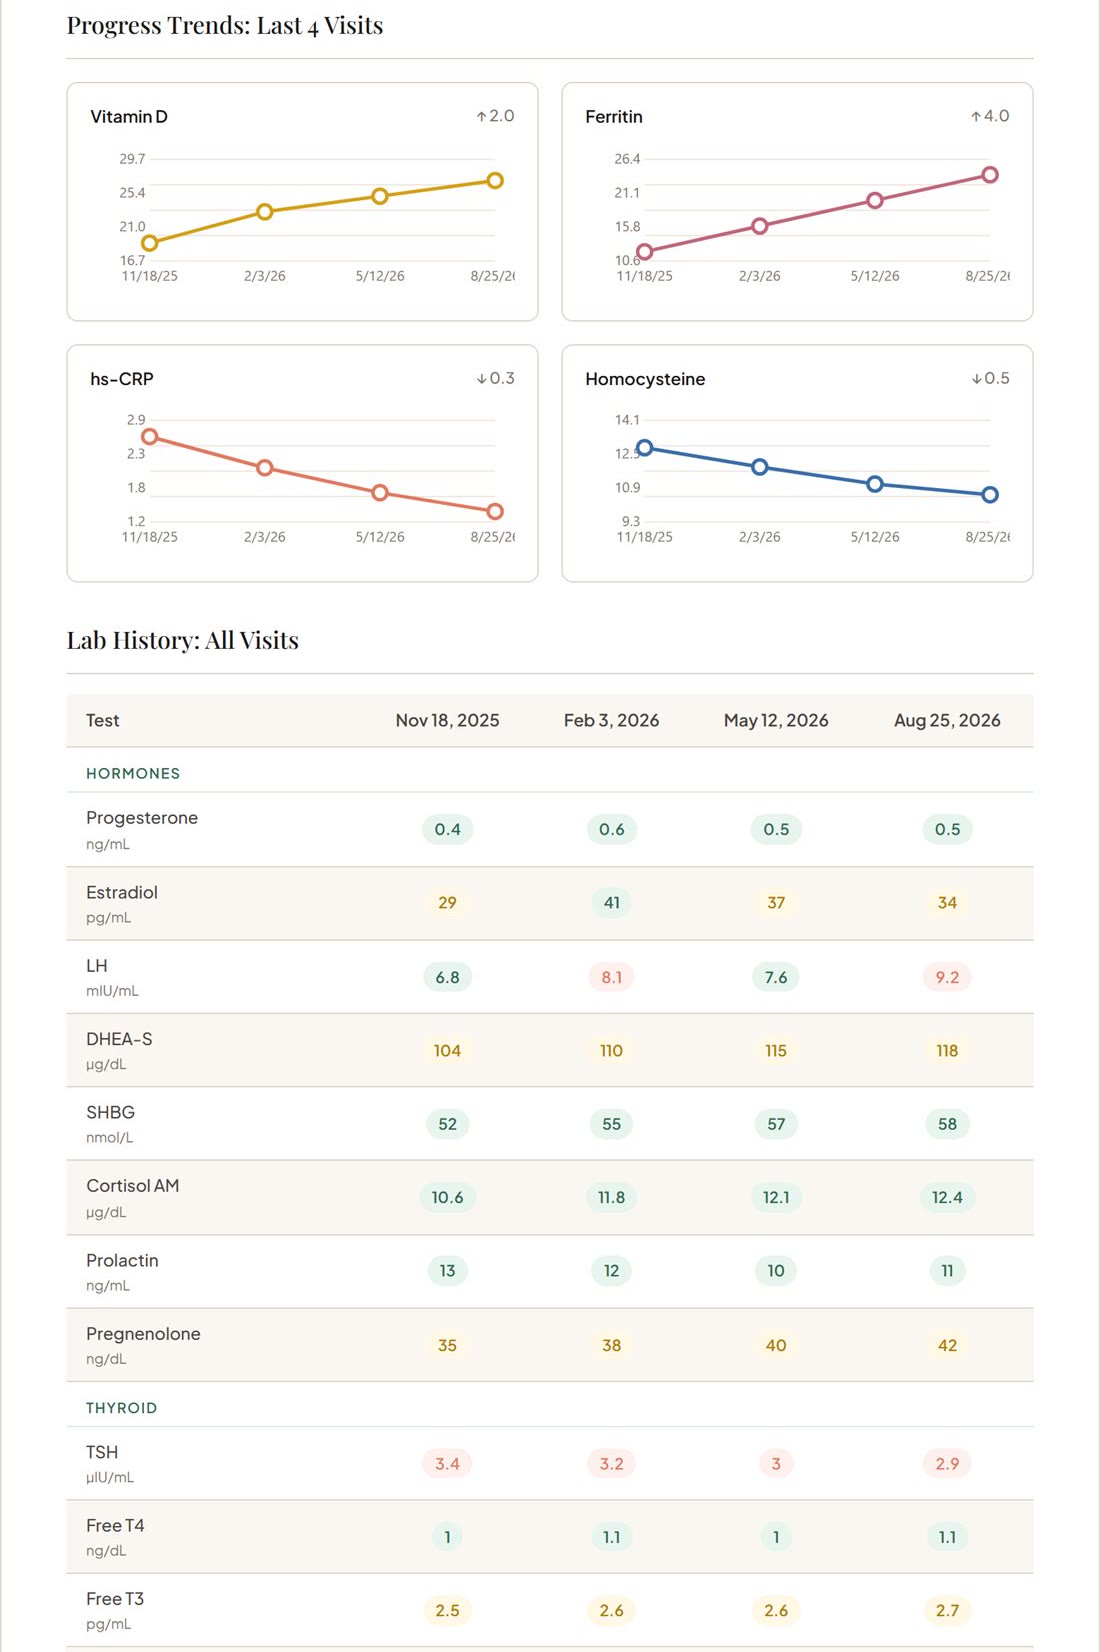
Further down the same report, the client's history is already filled in.
 6
7
- 6Progress trends for key markers, charted across up to six visits (this one and the five before it) in draw-date order.
- 7A lab history table, if you choose to include it: each result side by side across those same visits, grouped by panel and colored against your ranges. No columns to line up by hand.
Download it as a PDF for your client portal, or to print out for in-person visits.
Make your next client report in minutes
Start a 7-day free trial, no credit card required. Or take the quick tour to see each screen first.
Start free trialThis article is educational content for practitioners. It is not medical or legal advice. Word, Google Docs and Canva belong to their owners and are mentioned only as examples.